Page Resources: About this Page | How to Navigate | The Impact of COVID-19 | Share Feedback
The ABC Data Exchange
Financial Assets and Income
The reality is that many families in our community are living paycheck to paycheck.
The measures contained in this page shine a light on different conditions that are relevant to a family’s or an individual’s fiancial stability. It is important that we look critically at this data to understand the patterns that are present across and among measures. Such patterns might include disparities by race/ethnicity, sex, and/or age; improving or worsening conditions over time; or significant difference among peer communitites. An understanding of these patterns equips us to work together to identify, explore, and address the underlying systemic inequities that are impacting our community.
Literature Review Highlights
Assets may raise a family’s income through the following channels: [1]
- Assets such as stocks bring passive investment income;
- Physical assets can allow people to pay less for services (people with cars do not have to pay for taxi / Uber);
- Help extend job search (having a car) or invest in human capital such as education;
- Car ownership increases employment and hours worked. [2]
- Functions as an insurance stock that allows job seekers to take more risks in the job market or relocate.
Asset poverty may negatively impact a family’s income through higher financial stress, which relates to increased absenteeism at work. [3]
Literature Review References
[1] Lerman, R. I., & McKernan, S. M. (2008). The effects of holding assets on social and economic outcomes of families: A review of theory and evidence. The Urban Institute, November.
[2] Raphael, S., & Rice, L. (2002). Car ownership, employment, and earnings. Journal of Urban Economics, 52(1), 109-130.
[3] Kim, J., Sorhaindo, B., & Garman, E. T. (2006). Relationship between financial stress and workplace absenteeism of credit counseling clients. Journal of Family and Economic Issues, 27(3), 458-478.
Major Finding
Significant racial/ethnic disparities were present across all financial assets and income measures. White residents and households had better outcomes than Black and Hispanic/Latino residents and households across all measures.
Asset Poverty
Asset Poverty is a condition in which an individual, family, or household lacks the savings to cover basic expenses (at federal poverty level) for three months if their income is interrupted. Liquid Asset Poverty is a similar measure, in which the household lacks the savings to cover basic expenses at the federal poverty level for three months, but only considers assets that are more readily accessible and does not include wealth building vehicles like a home or business assets. View data notes for this measure.
Data Visualization
Estimated Asset Poverty and Liquid Asset Poverty (Forsyth County, 2021)
Use the dropdown menu below to view data on different groups.

Key Takeaways
Approximately 23% of Forsyth County households were in Asset Poverty in 2021, while 32% were in Liquid Asset Poverty.
Major Asset Poverty disparities were present by race/ethnicity in Forsyth County.
About 17% of White households were living in Asset Poverty in 2021 compared to 46% of Black and 37% of Hispanic/Latino households.
The Liquid Asset Poverty rate was higher than the Asset Poverty rate in 2021 for all racial/ethnic groups with disparities remaining stark.
Approximately 54% of Black and 62% of Hispanic/Latino households were in Liquid Asset Poverty compared to 24% of White households.
Zero Net Worth
A person’s net worth is the sum of all of their assets (things like cash, savings, an automobile, or a home, for example) minus the combined value of their liabilities (also known as debts). A person with a negative or zero net worth lacks the assets to cover their liabilities and is left in a financially vulnerable situation. View data notes for this measure.
Data Visualization
Estimated Zero Net Worth (Forsyth County, 2021)
Use the dropdown menu below to view data on different groups.
Key Takeaways
About 14% of households in Forsyth County had a negative or zero net worth in 2021
Major disparities were present by race/ethnicity.
About 34% of Black or African American households and 18% of Hispanic/Latin0 households had a negative or zero net worth compared to 12% of White households.
Data Notes
Asset Poverty
Data provided here are based on modeled estimates. For more information click here.
Data Source(s):
- “Asset Poverty,” Prosperity Now Scorecard (Washington, DC: Prosperity Now, 2023). Data Source: https://scorecard.prosperitynow.org/data-by-issue#finance/localoutcome/asset-poverty-rate. Retrieval date November 28, 2023.
- “Liquid Asset Poverty,” Prosperity Now Scorecard (Washington, DC: Prosperity Now, 2023). Data Source: https://scorecard.prosperitynow.org/data-by-issue#finance/localoutcome/liquid-asset-poverty-rate. Retrieval date November 28 2023.
Data Notes
Zero Net Worth
Data provided here are based on modeled estimates. For more information click here.
Data Source(s):
- “Households with Zero Net Worth,” Prosperity Now Scorecard (Washington, DC: Prosperity Now, 2023). Data Source: https://scorecard.prosperitynow.org/data-by-issue#finance/localoutcome/households-with-zero-net-worth. Retrieval date November 28, 2023.
Median Employment Income
Access to adequate financial resources is necessary for economic self-sufficiency. Median income of the working age population, 16 to 64 year olds, is an indicator of the financial resources available to middle-income households in our community. Median income of the working age population refers to the specific income level that is below the highest-earning 50% of the working age population and above the lowest-earning 50% of the working age population. Because income is closely tied to poverty, the Census Bureau and other studies use household income to determine poverty status [1,2]. View data notes for this measure.
Data Visualization
Median Income (Forsyth County, 2023)
Use the dropdown menu below to view data on different groups.

Key Takeaways
The median income in Forsyth County is similar to that of other comparison communities, except for Durham County.
In 2023, working-age residents in Forsyth County had a median income over $10,000 lower than in Durham County.
Adults aged 35 to 64 have the highest median income.
In 2023, their median income was approximately $50,000, compared to around $35,700 for those aged 16 to 34. Since 2009, the median income for 16-34-year-olds has increased by $8,000.
Disparities in median income by race/ethnicity persisted in 2023.
White residents had a median income of around $51,000, compared to approximately $36,700 for Black residents and $30,600 for Hispanic/Latino residents.
Disparities were present in median income by sex.
In 2023, males 18 and over had a median income of approximately $45,900 compared to around $38,700 for females.
Disparities were present in median income by educational attainment.
In 2023, residents with at least a Bachelor’s Degree had a median income of $12,200 to $34,600 higher than those without a four-year college Degree.
Data Notes
Median Income
References:
- Kushel, M., Gupta, R., Gee, L., & Haas, J. (2006). Housing instability and food security as barriers to health care among low-income Americans. Journal of General Internal Medicine, 21(1), 71-77. doi: 1111/j.1525-1497.2005.00278.x
- S. Census Bureau, Poverty thresholds by size of family and number of children. (2017). Retrieved from https://www.census.gov/data/tables/time-series/demo/income-poverty/historical-poverty-thresholds.html
Data Source(s):
- U.S. Census Bureau. (2024). American Community Survey (ACS), 1-Year Public Use Microdata Sample (PUMS), 2009-2019 and 2021-2023. Retrieved from Public Use Microdata Sample (PUMS).
Poverty
In practical terms, poverty indicates insufficient financial resources to pay for basic needs such as food, housing, and health care [1,2]. It is important to note that while poverty rates are widely used as a measure of financial hardship, there is some evidence that poverty rates rely on outdated assumptions, which can lead to underestimated family expenses and financial hardship [3]. For an alternative measure to poverty, see the income insufficiency measure above. View data notes for this measure.
Data Visualization
Poverty (Forsyth County, 2023)
Use the dropdown menu below to view data on different groups.

Key Takeaways
Poverty rates peaked at 22% in Forsyth County in 2012 and decreased to 16% in 2023.
Poverty rates are highest for children under 18 and lowest for adults 65 and older.
Although the percentage of children under 18 experiencing poverty decreased from its peak of 35% in 2012, it remained high at 28% in 2023. In comparison, poverty rates for other age groups in 2023 ranged from 10% to 16%, with the lowest among adults 65 and older.
There were significant disparities in poverty rates by race/ethnicity.
The percentage of residents who experienced poverty in 2023 was lowest among White residents (7%), higher among Black residents (17%), and highest among Hispanic/Latino residents (42%).
Residents with a high school diploma or less were more likely to experience poverty.
In 2023, about 21% of residents with a high school diploma or less experienced poverty, compared to 1-12% in other educational attainment categories.
Data Notes
Income Insufficiency
The following paragraphs provide an overview of Forsyth Futures’ income insufficiency measure for Forsyth County. For more information on this measure’s methodology, click here.
The Census Bureau defines the poverty level of families based only on income, family size, and the number of children and adults 65 and over [2]. It does not consider location or any other factor that could influence expenses. As a result, in 2016, the average family of four was not considered to be in poverty if they had an income of at least $24,563, regardless of whether they lived in New York City or rural North Carolina. Additionally, there is some evidence that these estimates rely on outdated assumptions, which cause them to underestimate family expenses and financial hardship [1]. The flaws in the current measure are widely recognized. While researchers have been actively investigating alternative methodologies [3], the Census Bureau has not replaced its poverty calculations and researchers continue to commonly use Census Bureau poverty statistics [4].
Forsyth Futures attempted to address shortcomings in poverty calculations by creating alternative expense estimates based on a more detailed consideration of family circumstances. It built on similar analyses in the Self-Sufficiency Standard created by the Center for Women’s Welfare at the University of Washington for the United Way and the Living Wage Calculator developed by Dr. Amy Glasmeier at the Massachusetts Institute of Technology (MIT). Forsyth Futures’ model estimates eight categories of expenses:
- Childcare
- Food
- Housing
- Transportation
- Healthcare
- health insurance
- other expenses
- taxes.
These estimates represent the lowest cost of living that can be generally assumed for each family type based on the information available; they are designed to identify income levels that could reasonably support families of different sizes.
References:
- National Research Council (1995). Measuring poverty: A new approach. Washington, D.C.: National Academy Press. Retrieved from: https://www.nap.edu/read/4759
- S. Department of Commerce. (2017). Poverty thresholds – 2016 [Data File]. Retrieved from: https://www.census.gov/data/tables/time-series/demo/income-poverty/historical-poverty-thresholds.html
- Short, K. S. (2005). Material and financial hardship and income-based poverty measures in the USA. Journal of Social Policy, 34(1), 21-38. doi: 10.1017/S0047279404008244
- Chetty, R, & Hendren, N. (2015). The impact of neighborhoods on intergenerational mobility: County-level estimates . Retrieved from: https://scholar.harvard.edu/files/hendren/files/nbhds_paper.pdf
Data Notes
Poverty
- The poverty measure is based on an income-to-poverty ratio. The ratio is a product of the total family income divided by the poverty threshold. View poverty thresholds by family size from the US Census Bureau.
- Although there is a disparity in poverty rates by race/ethnicity, the margin of error for Hispanic/Latino residents is high in most years, so exact percentage differences should be interpreted with caution.
References:
- Kushel, M., Gupta, R., Gee, L., & Haas, J. (2006). Housing instability and food security as barriers to health care among low-income Americans. Journal of View poverty thresholds by family size from the US Census Bureau.General Internal Medicine, 21(1), 71-77. doi: 1111/j.1525-1497.2005.00278.x
- S. Census Bureau, Poverty thresholds by size of family and number of children. (2017). Retrieved from https://www.census.gov/data/tables/time-series/demo/income-poverty/historical-poverty-thresholds.html
- National Research Council (1995). Measuring poverty: A new approach. Washington, D.C.: National Academy Press. Retrieved from: https://www.nap.edu/read/4759
Data Source(s):
- U.S. Census Bureau. (2024). American Community Survey (ACS), 1-Year Public Use Microdata Sample (PUMS), 2009-2019 and 2021-2023. Retrieved from Public Use Microdata Sample (PUMS).
Household Banking Status
Banking status is critical to financial security and many day-to-day economic activities rely on the assumption that individuals have full access to traditional banking institutions [1, 2]. Banking with a Federal Deposit Insurance Corporation (FDIC)-insured bank provides a safe place for individuals to store their money, cash checks for free, pay bills, and provides an opportunity to access other products from the bank such as credit financing and loans. The FDIC describes those without a checking, savings, or money market account as unbanked [3]. Those that have a bank account but also use alternative financial services such as money orders, payday loans, pawn shop loans, and paycheck advances are considered underbanked. Nationally, the unbanked and underbanked “are more likely to have low income, less education, or be in a racial or ethnic minority group [3].” These are groups that also have historically been or felt excluded from traditional banking services [2]. Thus, some of those who are unbanked or underbanked may not trust banking institutions given the historical context. Additionally, some banks require a minimum balance in the account at all times, which affects those with lower or inconsistent income.
Disparities exist and persist in part because of those aforementioned issues with traditional banking, but for those who use alternative financial services there are additional financial costs that significantly affect users [2]. For example, those who use prepaid cards as a substitute for a debit or credit card may pay an activation fee, a monthly fee, and/or a fee to deposit or withdraw money from an ATM.
A pilot banking program via the USPS began in September, 2021 to help the underbanked and unbanked [4]. The program was launched across four United State cities to provide customers with opportunities to cash checks up to a certain amount, use ATMs, pay bills, and put money on a gift card without the fees associated with more predatory alternative financial services such as the payday lenders [4].
Data Visualization
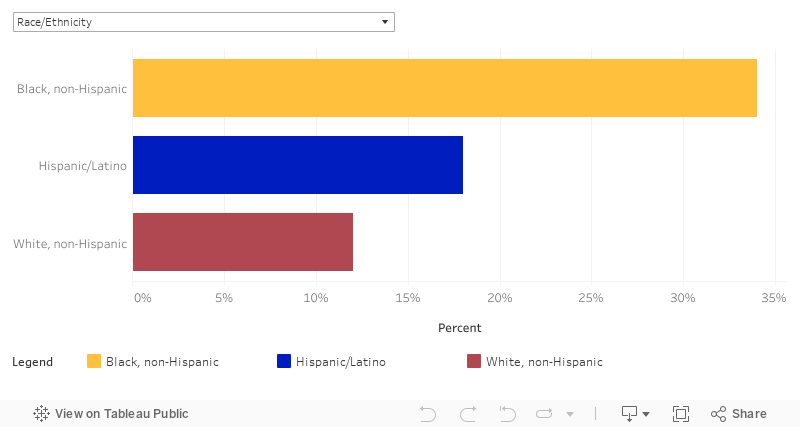
Estimated Unbanked and Underbanked Households (Forsyth County, 2021)
Use the dropdown menu below to view data on different groups.
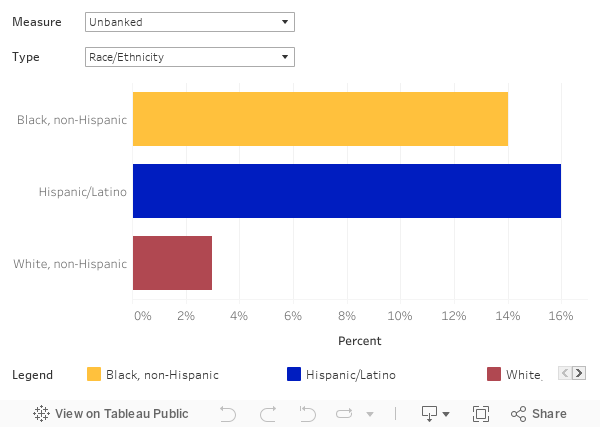
Key Takeaways
In 2021, 5% of Forsyth County households were unbanked while 15% were underbanked.
Approximately 3% of White households were unbanked compared to 16% of Hispanic/Latino households and 14% Black households.
Additionally, 13% of White households were underbanked compared to 37% of Hispanic/Latin0 households and 34% of Black households.
Data Notes
Household Banking Status
Data provided here are based on modeled estimates. For more information click here.
References:
- Federal Deposit Insurance Corporation. (n.d.). Top Reasons to #GetBanked. https://www.fdic.gov/getbanked/pdf/top-reasons-to-open-a-bank-account.pdf
- Birken, E.G. (2020, July 8). The Costs of Being Unbanked or Underbanked. Forbes. https://www.forbes.com/advisor/banking/costs-of-being-unbanked-or-underbanked/
- Board of Governors of the Federal Reserve System. (2021, May 21). Report on the Economic Well-Being of U.S. Households in 2019 – May 2020. https://www.federalreserve.gov/publications/2020-economic-well-being-of-us-households-in-2019-banking-and-credit.htm
- Tsirkin, J. and McCausland, P. (2021, October 4). Can a post office be a bank? New services test a progressive priority. NBC News. https://www.nbcnews.com/politics/politics-news/return-postal-banking-postal-service-tests-new-financial-services-rcna2502
Data Source(s):
- “Unbanked,” Prosperity Now Scorecard (Washington, DC: Prosperity Now, 2023). Data Source: https://scorecard.prosperitynow.org/data-by-issue#finance/localoutcome/unbanked-households. Retrieval date November 28, 2023.
- “Underbanked,” Prosperity Now Scorecard (Washington, DC: Prosperity Now, 2023). Data Source: https://scorecard.prosperitynow.org/data-by-issue#finance/localoutcome/underbanked-households. Retrieval date November 28, 2023.
The Impact of COVID-19
In 2020 and 2021, the COVID-19 pandemic dramatically reshaped how our community functions and it disrupted many aspects of our day-to-day lives. Many people experienced impacts to health and safety, increased stress, and many lost some or all of their ability to earn income. These and many other impacts on our community have tested our resolve, impacted our well being, and almost certainly changed the circumstances around our financial wellbeing in ways we don’t yet understand.
All of the data contained in this web-based informational resource is pre-pandemic; for more specific information, view the data notes that are available for each measure. These measures will be updated with 2020 data in late 2021, once that data becomes available.
If you have questions about the data contained in this informational resource, please contact info@forsythfutures.org.
About the ABC Data Exchange
Welcome to the ABC Data Exchange (ABCDE), part of the Asset Building Coalition's website. This resource is made up of six interconnected web pages which, together, offer in-depth data and context on the issue of Asset Poverty in Forsyth County, North Carolina.
The landing page of the ABCDE introduces the issue of Asset Poverty, and the impact it has on individuals and families in our community. Five additional, topic-specific data deep dive pages offer a broader range of data and contextual information.
The Asset Building Coalition's purpose and goals in producing this web-based resource are to:
- Build a hub of local information on financial wellbeing and asset poverty to be used as a tool for community stakeholders.
- Educate and raise awareness locally about asset poverty, its upstream causes, and the effects it has on individuals and our community overall.
- Highlight key issues, challenges, and disparities among core measures of asset poverty to catalyze local conversations about innovative and equitable solutions.
The Asset Building Coalition has produced this content in partnership with Forsyth Futures, a registered 501(c)(3) organization that provides action-oriented data analysis and reporting services to organizations within Forsyth County. If you have questions about this content, please contact info@abcforsyth.org.
Some measures in the ABC Data Exchange are based on modeled estimates
Some measures contained in the Data Exchange use estimates that are not solely based on local data. These estimates use local demographic and other information to predict local estimates based on analyst modeling of state-level data. That is, estimates are calculated at a state level that is then adjusted to local demographics.
Specific measures that are based on modeled estimates are clearly labeled within the data exchange.